 Catalogue PIGMA
100 m
Type of resources
Available actions
Topics
Keywords
Contact for the resource
Provided by
Years
Formats
Representation types
Update frequencies
status
Scale
Resolution
-
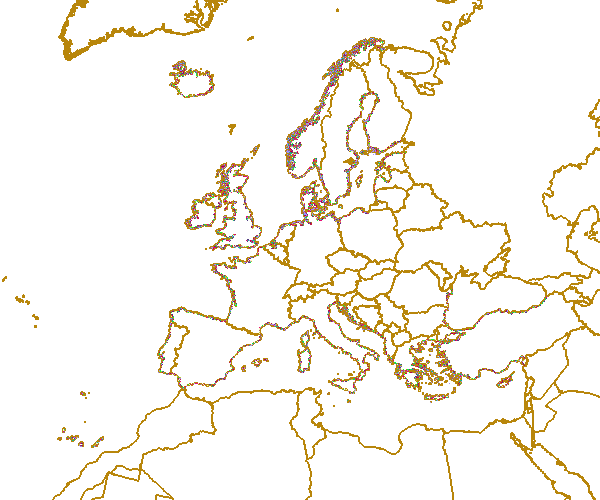
LaCoast is a research project undertaken in the mid 1990 under the lead of the Joint Research Centre (JRC) and aimed at quantifying the changes of land cover types in a 10 km land strip from the coastline. LaCoast uses CORINE Land Cover version 1990 as its reference dataset and track differences of land cover changes using LANDSAT satellite images from the mid-1970's.
-
Coastal zones are presented as a series of 10 consecutive buffers of 1km width each (towards inland). For this dataset, were treated as sea data all areas with class values of 52x (521: coastal lagoons, 522: estuaries, 523: sea and ocean) in Corine Land Cover (details in lineage).
-
Coastal zones are presented as a series of 10 consecutive buffers of 1km width each (towards inland). For this dataset, were treated as sea data all areas with a class value of 523 (sea and ocean) in Corine Land Cover (details in lineage).
-
Coastal zones are presented as a series of 10 consecutive buffers of 1km width each (towards inland). For this dataset, were treated as sea data all areas with a class value of 523 (sea and ocean) in Corine Land Cover (details in lineage).
-
Coastal zones are presented as a series of 10 consecutive buffers of 1km width each (towards inland). For this dataset, were treated as sea data all areas with class values of 52x (521: coastal lagoons, 522: estuaries, 523: sea and ocean) in Corine Land Cover (details in lineage).
-
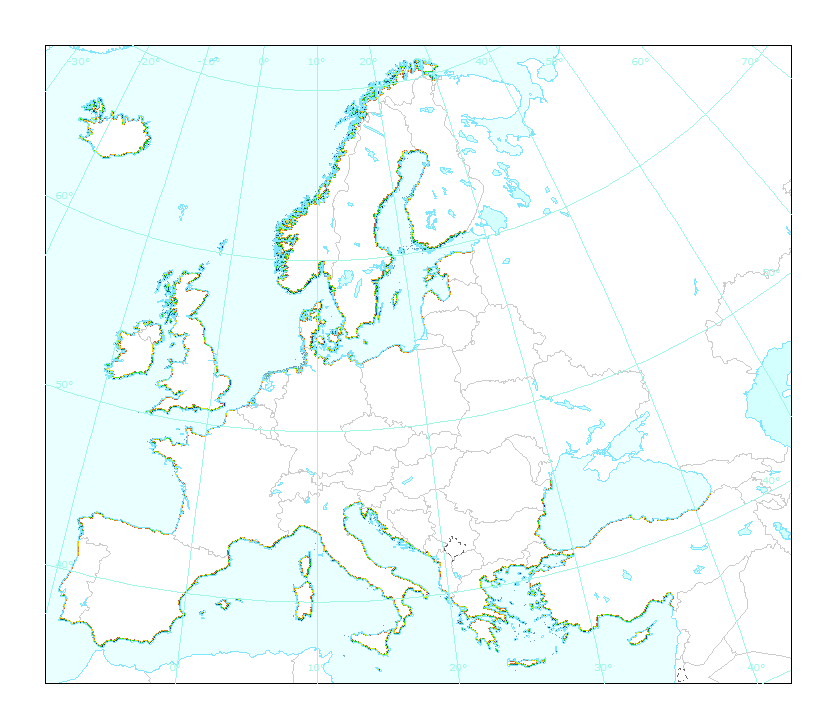
This dataset is the coastal zone land surface region from Europe, derived from the coastline towards inland, as a series of 10 consecutive buffers of 1km width each. The coastline is defined by the extent of the Corine Land Cover 2018 (raster 100m) version 20 accounting layer. In this version all Corine Land Cover pixels with a value of 523, corresponding to sea and oceans, were considered as non-land surface and thus were excluded from the buffer zone.
-
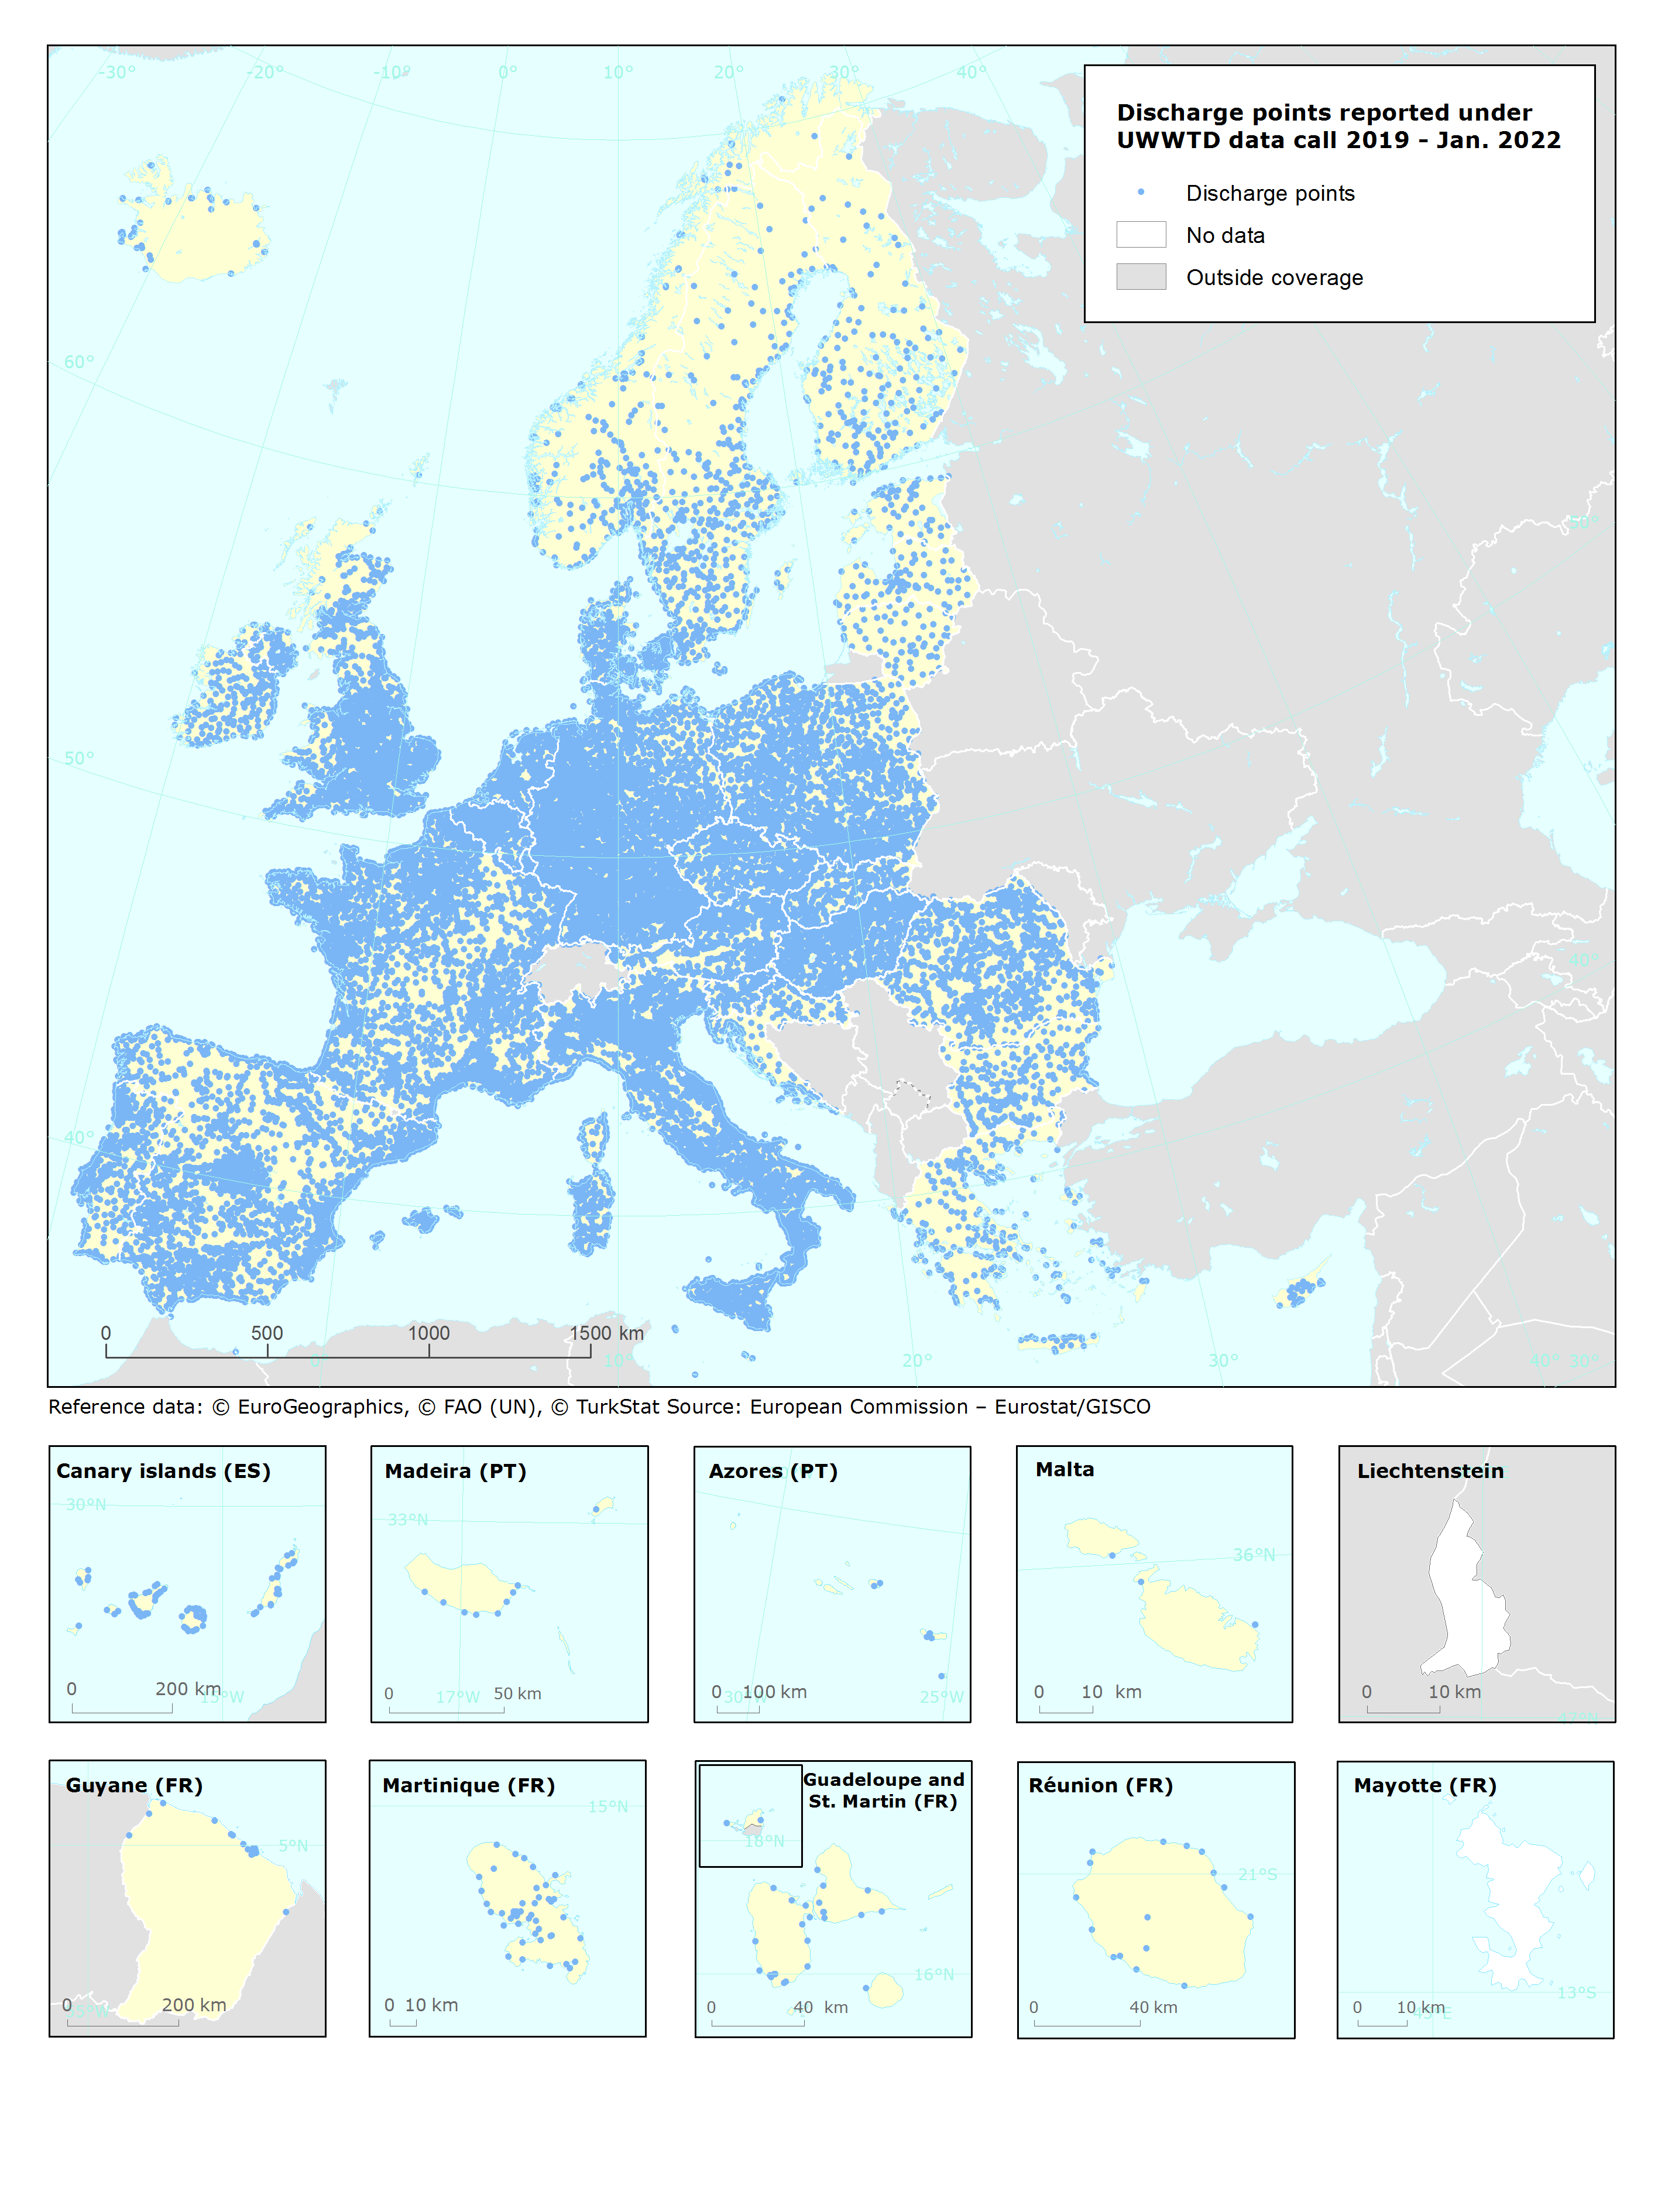
UWWTD Discharge Points, Jan. 2022 is one of the datasets produced within the frame of the reporting under 11th UWWTD Art.15 reporting period (UWWTD data call 2019). The Urban Waste Water Treatment Directive (UWWTD) (91/271/EEC) obliges Member States to report data on the implementation of the Directive upon request from the European Commission bi-annually. Reported data include receiving areas as designated under UWWTD, agglomerations, urban waste water treatment plants serving the agglomerations and points of discharges. Dataset UWWTD_DischargePoints contains information on individual points of discharge from urban waste water treatment plants or collecting systems, including their coordinates of discharge, link to specific treatment plant, type of receiving area into which the effluent / wastewater is discharged, related waterbody (or river basin), information on the discharge on land and potential reuse of the treated waste water. This dataset includes the reported discharge points which are displayed on the UWWTD maps (https://www.eea.europa.eu/themes/water/european-waters/water-use-and-environmental-pressures/uwwtd/interactive-maps/urban-waste-water-treatment-maps-3). The active discharge points with correct coordinates in the reported data were selected from the source European UWWTD tabular dataset, which is available on the download link https://www.eea.europa.eu/data-and-maps/data/waterbase-uwwtd-urban-waste-water-treatment-directive-7. The definition of the UWWTD Discharge Points dataset attributes (fields) is available on the link https://dd.eionet.europa.eu/datasets/latest/UWWTDArt15/tables/DischargePoints The full (internal) dataset including inactive discharge points is available under "Urban Waste Water Treatment Directive, Discharge points reported under UWWTD data call 2019 - INTERNAL VERSION, Jan. 2022". In comparison to the previous version (Nov. 2020), late redeliveries and corrections provided by several countries during 2021 are included in current revision. Next, the dataset is provided in GeoPackage and ESRI File geodatabase formats instead of shapefile used up to now, to avoid truncation of attribute names.
-
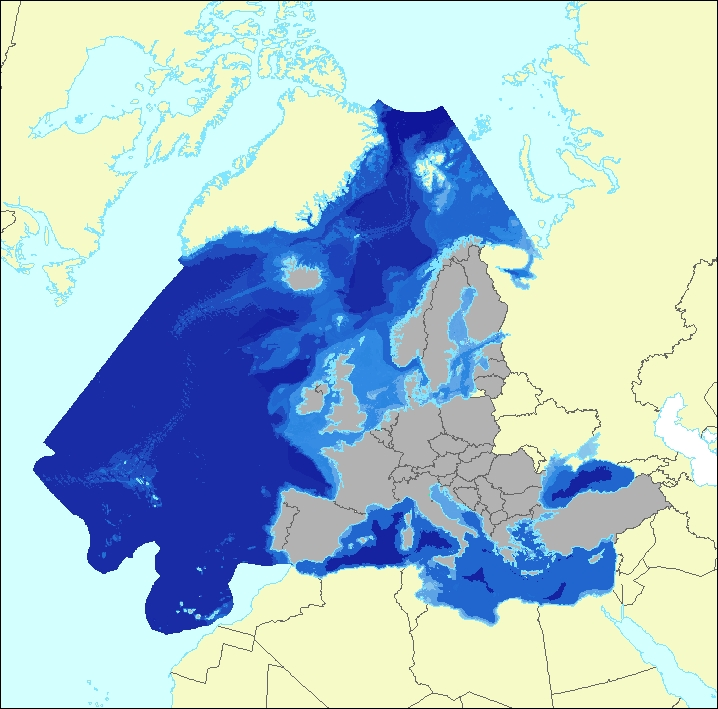
The data set aims to contribute to a better biological characterization of European marine ecosystems. As such it represents probabilities of EUNIS (EUropean Nature Information System) habitat presence at Level 3 for marine habitats including information on sea ice coverage (this corresponds to EUNIS level 2 for terrestrial habitats). The map combines spatially explicit data on marine bathymetry and sea-bed with non-spatially referenced habitat information of the EUNIS classification. The objective of the data set produced by EEA and its Topic Centre ETC/ULS is to improve the biological description of marine based ecosystem types and their spatial distribution. The work supports Target 2 Action 5 of the implementation of the EU Biodiversity Strategy to 2020, established to achieve the Aichi targets of the Convention of Biological Diversity (CBD). It further addresses the MAES process (Mapping and Assessing of Ecosystems and their Services). The data set represents 2 classes of the MAES classification level 3, namely “Marine inlets and transitional waters” and “Marine”. The dataset comprises the following information: • Sea region (1 – Arctic, 2 – Atlantic, 3 – Baltic, 4 – Mediterranean, 5 – Black Sea) • Sea zone (1 – Littoral, 2 – Infralittoral, 3 – Circalittoral, 4 – Offshore circalittoral, 5 – Upper bathyal, 6 – Lower bathyal, 7 – Abyssal,8 - Coastal Lagoons, 9 - Coastal Lagoons) • Substrate (0 – undetermined substrate, 1 – rock and biogenic, 3 – coarse sediment, 4 – mixed sediment, 5 – sand, 6 – mud) • Sea ice coverage (0 – no sea ice presence, 1 – seasonal sea ice presence, 2 – perennial sea ice presence)
-

Communes adhérentes à la Communauté d'Agglomération du Bassin de Brive.